Setup debugger in WebStorm for TypeScript Projects
May 5, 2023
To use or not to use a debugger..
In this article I will show you how to setup your debugger for a TypeScript project in Webstorm (a JetBrains IDE) with visuals, step-by-step.
Two main scenarios of setting up your debugger.
-
Your project gets compiled and fully ran by your tooling (e.g. Next.js, T3, etc.)
-
Your project gets compiled and the output runs on the server-side (e.g. any server-side Node.js project)
Setting up your debugger for scenario 1
This is the simple one. Just follow these steps:
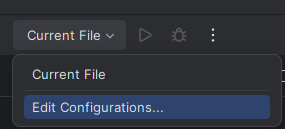
Select the `Edit Configurations...` option from the drop-down menu next to the play button.
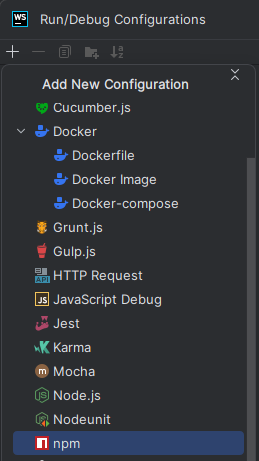
Click on the `+` button, find, and select `npm`.
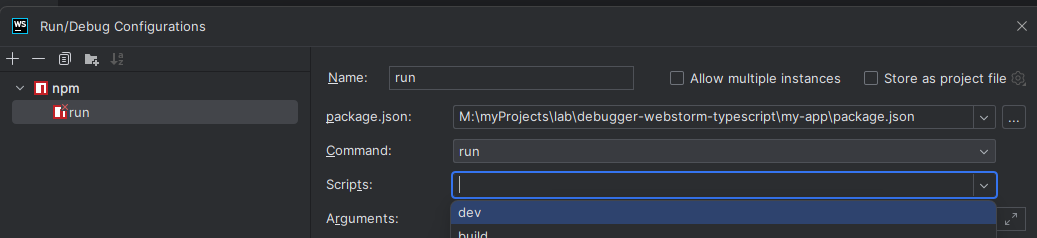
Then make sure the `package.json` field is correctly pointing to your `package.json` file, and in the `Scripts` field, select the script
you want to run. In this case, I'm selecting the `dev` script (stands for development, surprisingly).
Then click `OK` and you're done! Now hit the play button and you're good to go! Don't forget to set breakpoints 🤗
Setting up your debugger for scenario 2
For this one, you need to do a little bit more work. But don't worry, it's not that hard. It goes similar to the previous
scenario, but instead of selecting `dev`, you need to select `build` to build your project. This will compile your TypeScript code
to JavaScript code.
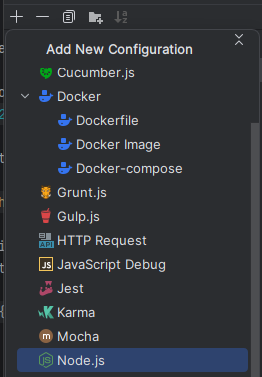
Then you need to create another configuration, but this time, select `Node.js`.
Before trying to point to the JavaScript file, make sure you have compiled your TypeScript code to JavaScript code at least once. If you don't do this, WebStorm will not be able to find your compiled JavaScript file as it does not exist in your file system!
Then make sure the `JavaScript file` field is correctly pointing to your compiled JavaScript file. In this case, I'm selecting the `main.js` file.
Also, make sure the working directory is correctly pointing to the `dist` or output folder of your project.
Make sure you have set your environment in the `Environment variables` field. WebStorm debugger will not read your `.env` file!
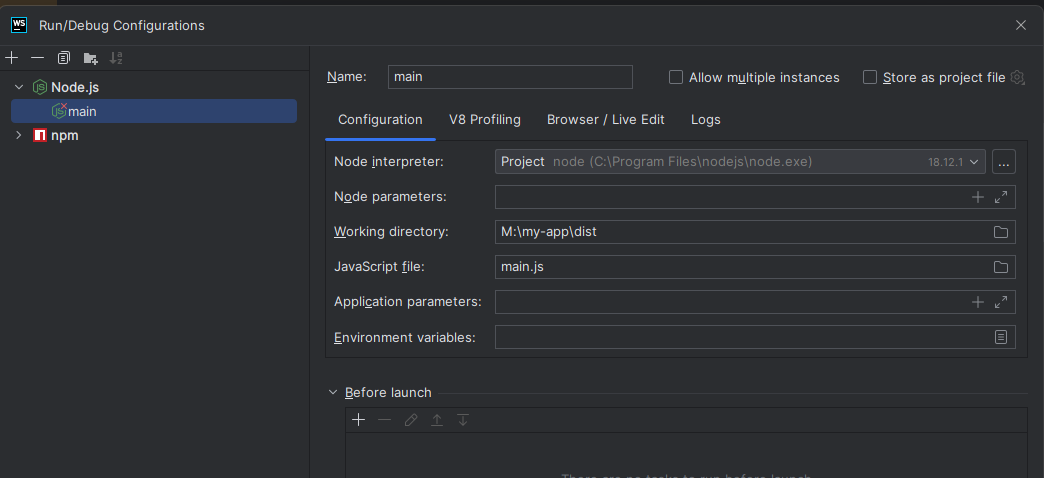
Now, you're almost done. So far, you have directed WebStorm to run your compiled JavaScript file. But you also want to run your
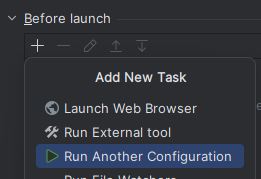
build command in order to produce those compiled JavaScript files. So, you need to add a `Before launch` configuration.
For that, click the `+` button, and select `Run another configuration` if you already setup the `npm` configuration that runs the build
script. Or, you can select `npm` and setup the build script there from scratch.
Now, hit the play button and you're good to go! Again, don't forget to set breakpoints 🤗
I'm planning to make another blog showcasing how to use the debugger and how to debug your code. So, stay tuned for that!
If you want to learn more about how to use a debugger, I have a post just for that! You can read it here.
I hope you enjoyed this article. If you have any questions, feel free to reach out to me. I always welcome feedbacks and criticisms. 😊
I'm happy to help! ❣️