When and How to Leverage a Debugger
May 13, 2023
I love debuggers. Even though sometimes I log to the console, I lean more towards using debuggers and I really like this saying about not debuggers:
When you're not using a debugger, it's like trying to navigate in the dark.
I believe more people should start using debuggers. My guess is that people don't feel confident setting up the debugger because they think it's a difficult process and takes their time.
Hence, I made this article to show you how easy it can be to set up despite the perception that it's difficult.
Why should you use a debugger?
Furiously logging things to your console can sometimes be tiring. Haven't you ever written swear words in your console? (Don't do that; it's not a good practice)

console.log("-----------", user, user.friends);

console.log("I am", user)
console.log("@*%%^#$#$(", req.cookie)
console.log("******", user.password) // 🤦
Here, I just want to know what's the value of `user` in my code. Is that why it's not working? Or is it because of `user.friends`? I don't know.
If I use a debugger, all I have to do is to click next to the line where I'm reading the value of `user` to set a breakpoint.
And, next time I run my app, not only I can see the value of `user` and it's ancestors, but I could move through it line-by-line.
When should you even use a debugger?
You should use a debugger as much as you can. If the project allows you to use a debugger in a sense that it doesn't make your workflow slower, then you should definitely use it.
Sometimes, using a debugger is not the best idea. For example, if you're developing a fast-paced real-time application (e.g. multiplayer games), using a debugger is almost impossible. In this case, you kind of have to use logging to the console. But, let's say you are developing a software that doesn't require real-time interaction as much. Or if it does, it's slow and there are not so many events that are simultaneously happening.
I genuinely believe that it helps with developer productivity. You'll have less mental overhead while debugging. It's similar to a calculator. You can do math without a calculator. But, it's much easier and faster to use a calculator.
How to use it?
This article won't cover how to setup a specific debugger. It rather focuses on how to use a debugger once you set it up. Depending on your programming language and your project environment, you'll need to find your debugger and actually take the time and read their instructions.
I do have an article that shows how to setup a debugger for a Node.js project on JetBrains IDEs. You can check that out here.
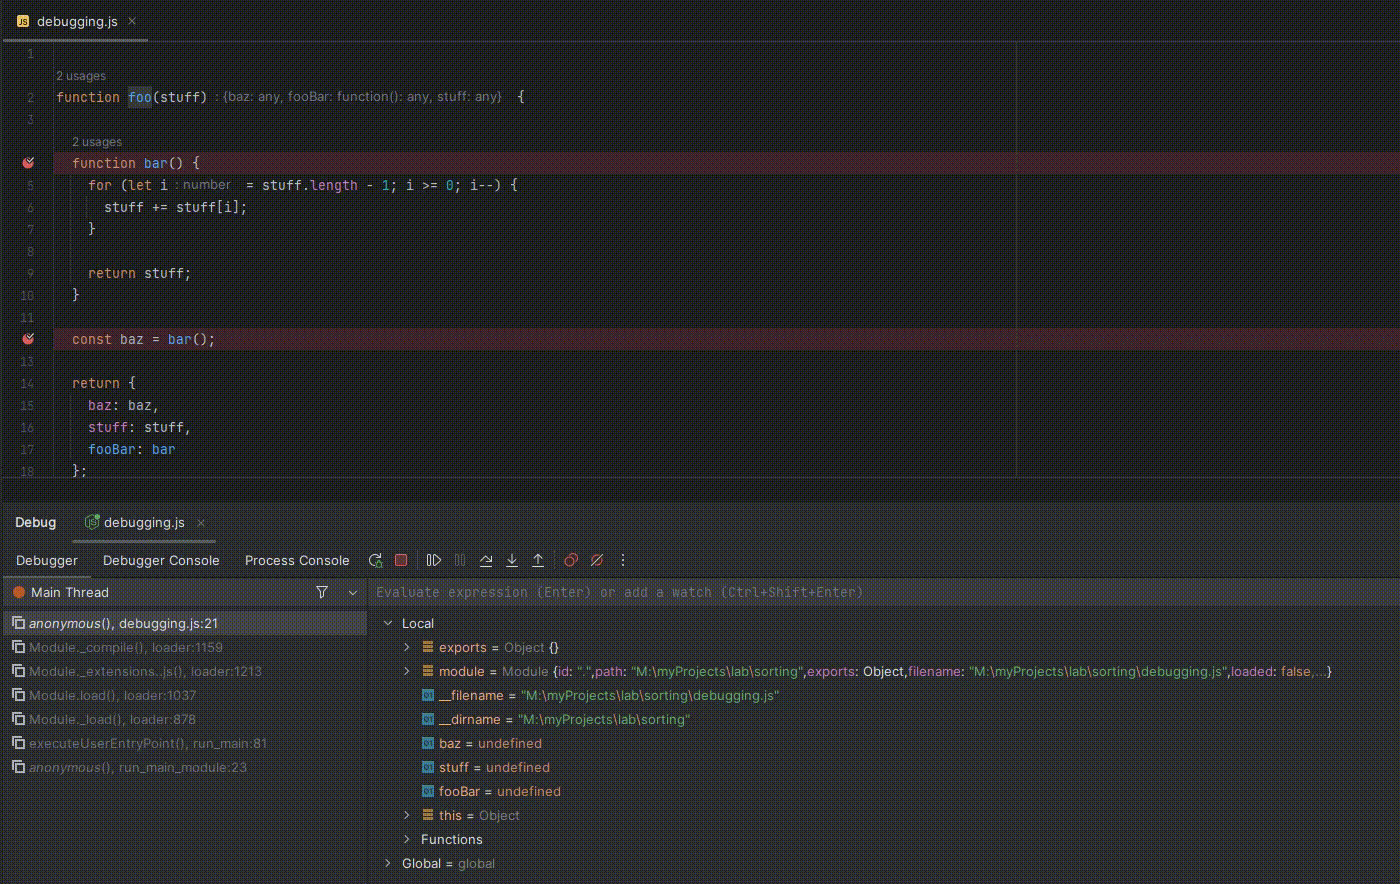
What's a breakpoint?
A breakpoint, as its name sounds, is a point you set on a line of your code where you want to stop your app from running further and start analyzing every variable in that part of your code.
You can jump over the next line from the breakpoint you set, or you can go inside a function call and see what happens in that function. The debugger tool will let you see every variable in your scope and their values, so you don't have to log them yourself manually.
Setting a breakpoint
Setting a breakpoint is easy. All you have to do is to click on the line number where you want to set a breakpoint.
Depending on which IDE you're using, you can set a breakpoint by clicking on the left side of your code editor where the lines reside.
If you're using a VSCode IDE, you can also click on the left side of the line number to set a breakpoint. It's the same thing for JetBrains IDEs and other modern IDEs.
Running the debugger
Once you set a breakpoint, you can run your app. Hit that play button or the button with a bug icon. Usually, your editor
should give a hint of what key combination you should use to run the debugger. For example, in VSCode, you can use `F5` to
run the debugger. It could vary depending on your editor.
Debugging
Now, let's say I'm debugging a JavaScript file.
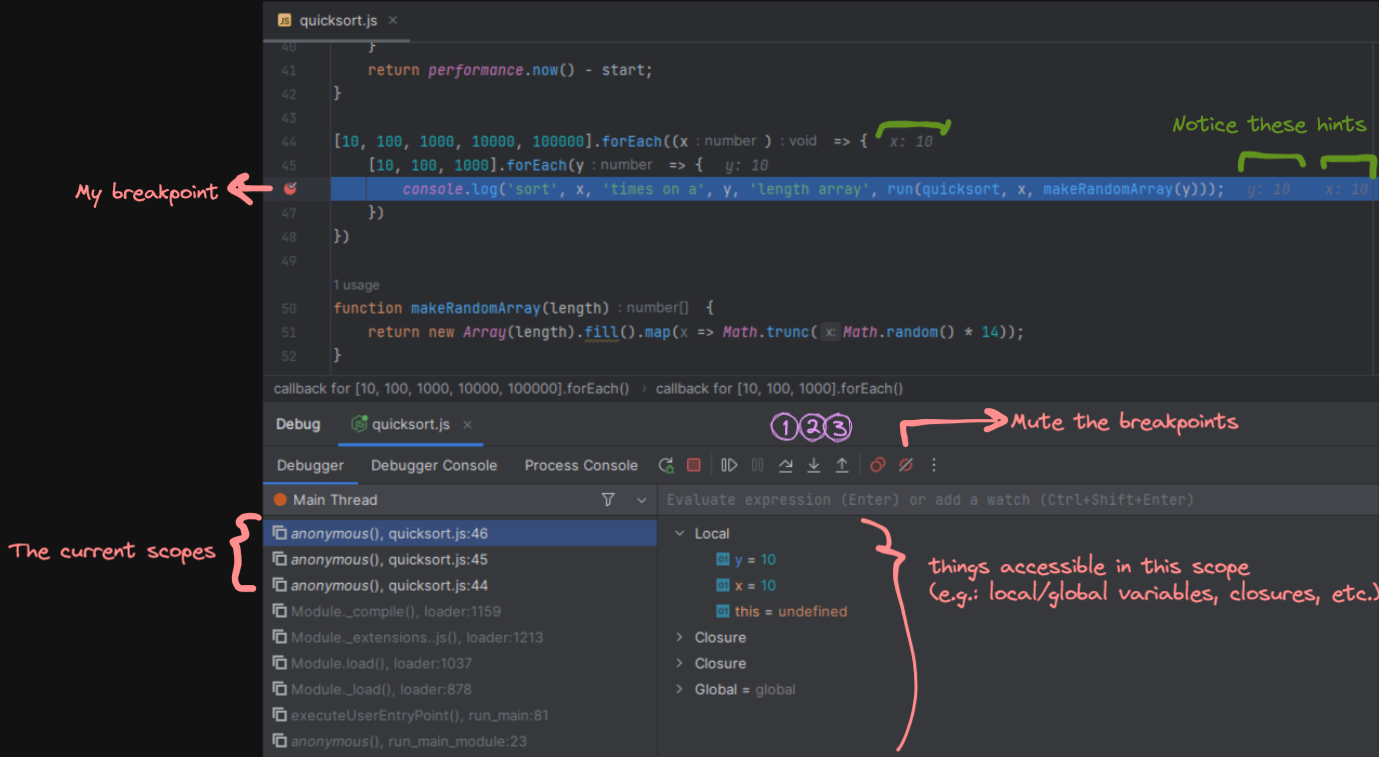
Notice how the debugger stopped at the line where I set a breakpoint. Now, I can see everything!
Now, I have a few options to play with:
- Step over: This will move to the next line. If the next line is a function call, it won't go inside the function and will just move to the next line.
- Step in: If you want to go inside a function, you can use this.
- Step out: If you're inside a function and want to go back to the caller, you can use this.
And, I recommend using the keyboard shortcuts for these. It's much easier and faster than clicking on the buttons.
Here's some points that I want to highlight:
- If I wish, I could also change the value of a variable in runtime.
- I have the power to mute my breakpoints. This is useful if I want to run my app without stopping at a breakpoint.
- If I have a
`console.log`, I can still see the output in the console. But, I can also see the output in the debugger. - I can see every variable in my scope. I can also see the value of the variable by hovering over it.
Conclusion
Again, I'm not saying that you should use a debugger all the time. But, if you're not using a debugger at all, you should probably start using it. What I always tell people is that, using a debugger can prevent your hair from turning grey faster.
I hope you enjoyed this article. If you have any questions, feel free to reach out to me. I always welcome feedbacks and criticisms. 😊
I'd love to hear your thoughts about debuggers.
Do you use a debugger? If not, why? If yes, why?
Let me know. 👇👇👇